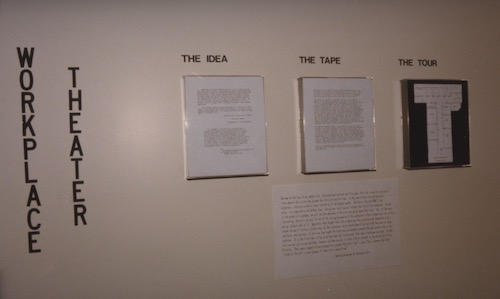
Workplace Theater
While working at Boys Town (this is now over thirty years ago), I created a “taped tour” of the evaluation reports and products produced by the division that I oversaw. These reports were integral to the Boys Town Treatment Program but were known only to the administrators who used them. The taped tour allowed all staff (outside visitors, as well) to understand and appreciate the role that data and feedback played in helping the treatment program evolve.
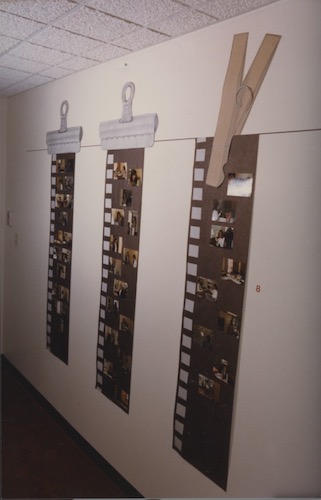
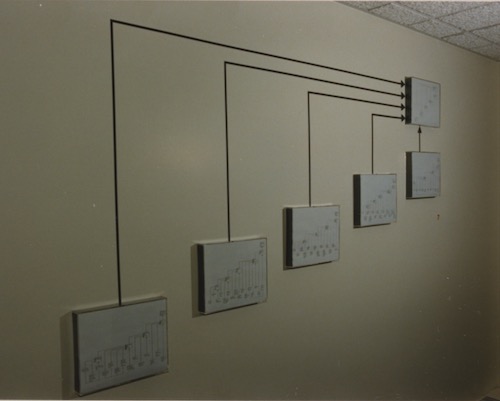
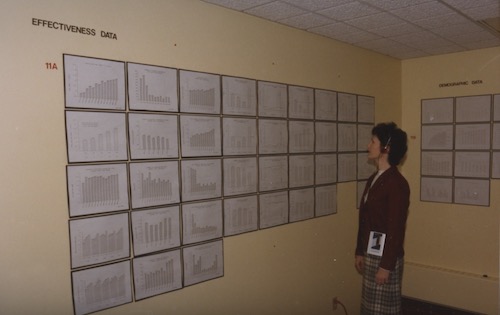
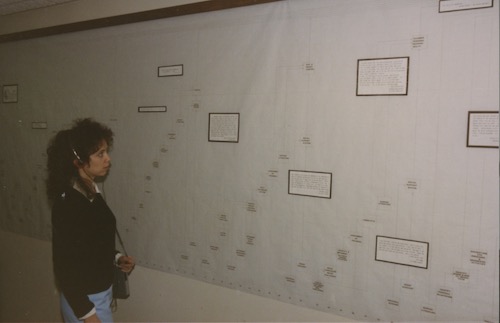
Hopefully, the few faded pictures below give a sense of the way in which the hallways of the division were transformed. Following the pictures is a more detailed explanation of the project.
Project Goals and Objectives
— To make a gallery exhibiting the Division of Program Evaluation’s reports and processes;
— To make a taped tour through the gallery explaining the exhibits and thus, the feedback and evaluation processes integral to the treatment program;
— To make the tour available to all employees, from maintenance staff to secretaries to teachers to administrative staff – and, as well, to make the tour a regular part of training and orientation both for new employee and existing staff;
— To enrich the division with the human factor; that is, to bring to the division a stream of visitors never otherwise contacted in the course of a workday.
The gallery consisted of thirty-two exhibits, twelve of which were on the taped tour. Though the exhibits displayed graphs, tables and lattices, primarily, the overall impact of thirty-two such exhibits was quite dramatic.
Results
In the twelve months prior to the completion of the gallery/taped tour, eight visitors, mostly from outside the organization, came for an orientation to Program Evaluation’s reports and processes.
In the twelve months following the completion of the gallery/taped tour, one hundred and seventy-three visitors received an orientation to Program Evaluation’s products and services. Only fourteen were from outside the institution.
A quiz was administered before and after the tour to the first 159 visitors. Their average pre and post scores were as follows:
Administrators (N = 37) 30% – 87%; Family–Teachers (N = 87) 27% – 86%; New Family-Teachers (N = 67) 22% – 84%; School Personnel (N = 6) 42% – 78%; Secretarial Staff (N = 20) 20% – 83%; Technical Staff (N = 4) 20% – 85%; Maintenance Staff (N = 5) 14% – 86%.
It’s important to note that traditional employee orientation programs would have excluded many of the groups listed above. It’s not essential that they know about these reports and processes, so why spend the money or take the time?
The tour format, however, the come-when-you-can move-at–your-own-rate format, included them, permitting maintenance staff, secretarial staff, teachers, and computer programmers to learn about processes integral to the organization of which they are a part but known only to those few who use them.
“…be guided by this rule: An employee cannot have too much information.”
James A. Autry, the Meredith Corporation
Afterword
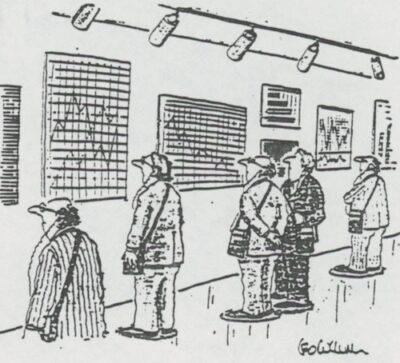
Several months into this project, a colleague asked me if I had seen the cartoon in the New Yorker. “What cartoon,” I asked. He went to his office and return with the cartoon below. It represents the “theater” we brought into our everyday workplace.